VisionONE ERP · Management Reporting & Dashboards
Turn connected information into useful insight.
Bring financial and operational reporting, configurable indicators, exception alerts and analytics into clear management views.
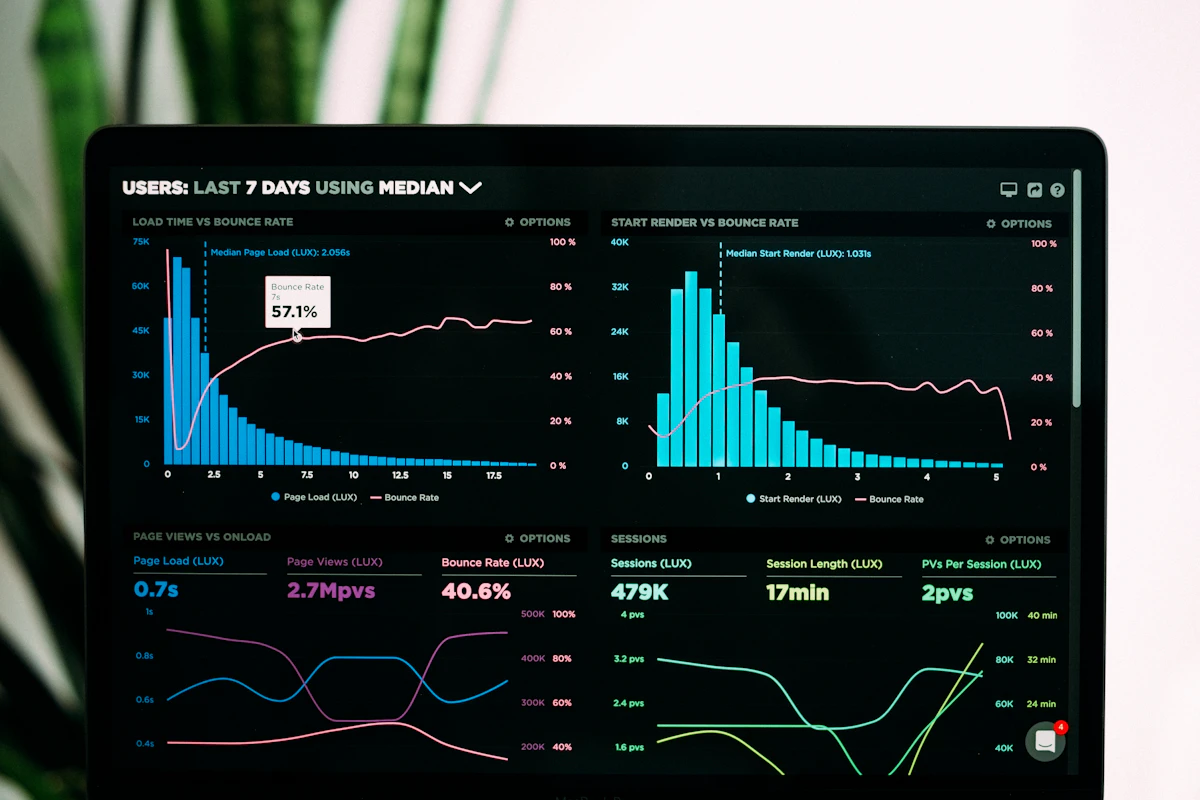
Connected management reporting & dashboards
Turn connected information into useful insight.
Bring financial and operational reporting, configurable indicators, exception alerts and analytics into clear management views.
VisionONE Management Reporting & Dashboards supports Configurable KPIs, Financial Reports, Operational Reports, Exception Alerts and Business Analytics within a connected ERP workflow, helping authorised teams maintain clearer records, coordinate responsibilities and understand related business activity.
Connected business management
Bring management reporting & dashboards into the wider business picture.
VisionONE connects the people, information and processes behind management reporting & dashboards. Teams gain a clearer view of everyday activity while management can understand how this area supports wider operational and financial priorities.
Configurable KPIs
Start each KPI with a business question and an agreed definition. Identify the calculation, reporting period, filters and person responsible for reviewing it. In a demonstration, compare a familiar indicator with its underlying records so managers can judge what the number includes and what it leaves out.
Financial Reports
Review financial reports against agreed ledger balances and reporting periods. Bring a report your finance team already uses and identify the required grouping, comparisons and supporting detail. Confirm how posted adjustments and period-end decisions affect the figures before accepting the report for regular management use.
Operational Reports
Choose operational reports around decisions your teams make, such as following outstanding work or reviewing activity by department. Agree the source records and the meaning of each status. Test a representative exception so users can distinguish a genuine business issue from missing or incomplete information.
Exception Alerts
Define an exception before choosing an alert: what condition should trigger attention, who should review it and what action follows. Ask the demonstration team to confirm the supported delivery methods and configuration. Include a process for reviewing unresolved exceptions so an alert has a clear operational purpose.
Business Analytics
Compare trends using consistent periods, definitions and business units. Check whether a change reflects underlying activity, a different filter or an adjustment to source data. Use a known example during evaluation and record the analysis your managers need, including any reporting work that requires separate configuration.
Connected Management Reporting & Dashboards Records
Reliable dashboards start with reliable source records. Use the data migration checklist to plan ownership and reconciliation of opening information. Agree the source of each report and the checks that will confirm its totals after migration and before operational sign-off.
Management Reporting & Dashboards Workflow Coordination
Agree who enters source information, who checks it and when it becomes ready for reporting. Map the handoff between the operational team and the manager using the dashboard. A useful acceptance test follows a corrected source transaction through to the report that should reflect the change.
Management Reporting & Dashboards Management Visibility
Choose management views around the decisions and access rights of each audience. Review these requirements with the ERP selection checklist, then ask to see the proposed views with representative data. Confirm permissions and report scope before sharing information across departments or entities.
Frequently asked questions
Questions about VisionONE Management Reporting & Dashboards
Clear answers to common questions about scope, connected processes and evaluating the solution for your organisation.
What does VisionONE Management Reporting & Dashboards help an organisation manage?
Bring financial and operational reporting, configurable indicators, exception alerts and analytics into clear management views.
Which management reporting & dashboards areas are covered?
The page focuses on Configurable KPIs, Financial Reports, Operational Reports, Exception Alerts, Business Analytics. The exact fit depends on your organisation’s processes and implementation scope.
How does management reporting & dashboards connect with the wider VisionONE ERP environment?
Relevant records and workflows can be managed alongside other VisionONE business areas, helping authorised teams work from more consistent information instead of isolated processes.
How can we assess VisionONE Management Reporting & Dashboards for our organisation?
Bring an anonymised management report, its expected totals and the questions your managers need to answer. Ask the demonstration team to explain the source, period, filters and reconciliation for a proposed dashboard. Record required configuration and ownership of each acceptance check before agreeing the reporting scope.
The VisionONE approach
Connected information. Clearer processes. Better-informed action.
Move beyond isolated tools and disconnected records. VisionONE Management Reporting & Dashboards supports a more coordinated approach to ERP business management, helping teams work with consistent information and leaders maintain a clearer operational view.
Discuss VisionONE Management Reporting & Dashboards